Schools & students
Smarter Applications. Better Offers.
Picking your five UCAS choices is one of the most consequential decisions you will make, and most students make it on partial information. We apply Bayesian and machine learning models to admissions data to find courses that genuinely fit your profile, so you apply with confidence rather than guesswork.
The Dashboard
Find the university courses that fit you, and where you'll actually get in
Working out which university courses to apply to is slow, confusing, and unfair on students without the time or the guidance to do it properly. Unimetrica does the work in seconds. Give us your predicted grades and your preferences, and we show you your offer chances and your fit for every course in your subject, mapped so you can compare them instantly. The algorithm then recommends the five courses that give you the best shot, balanced as a single portfolio rather than five separate guesses.
The portfolio
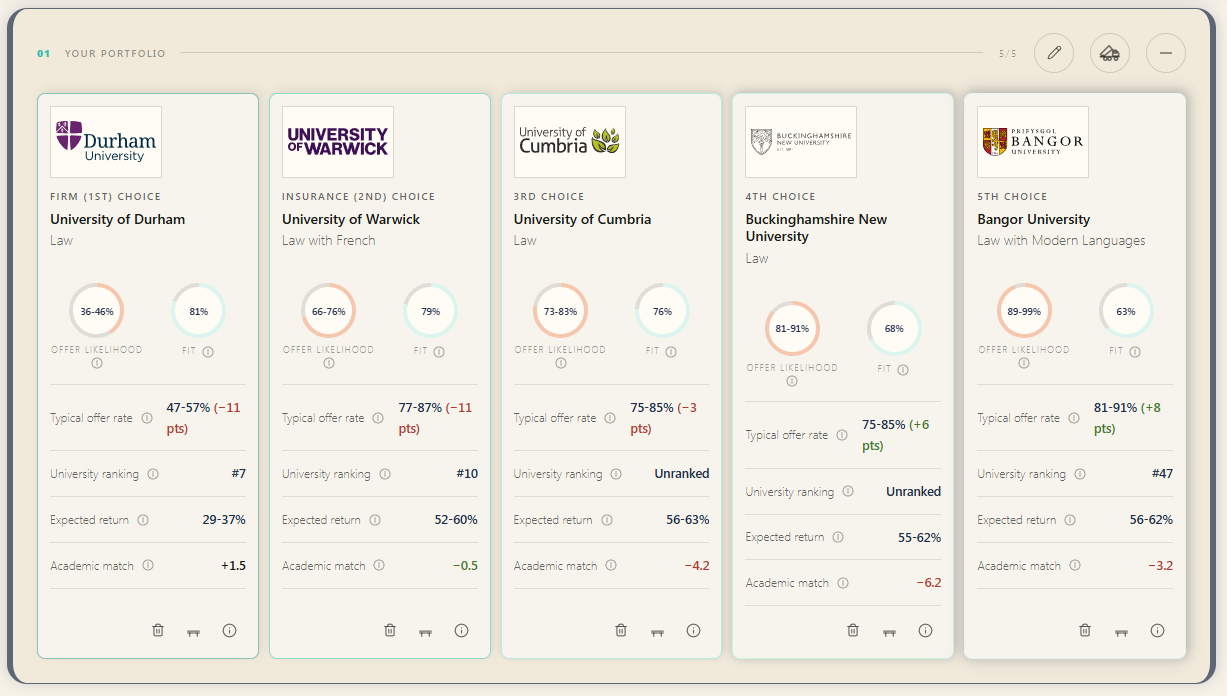
Five courses, ranked.
Most students apply on a hunch and hope for the best. Unimetrica shows you, for each of your five, your real offer chances and how well the course fits you, ordered the way you'll file them on UCAS. Swap any course and the algorithm rebalances the rest, so you're never carrying five hopeful guesses into results day.
These five are a strong starting point, not the final word. We'd always encourage you to play around with them, swap courses in and out, and refine the picture until it feels right for you.
The cohort table
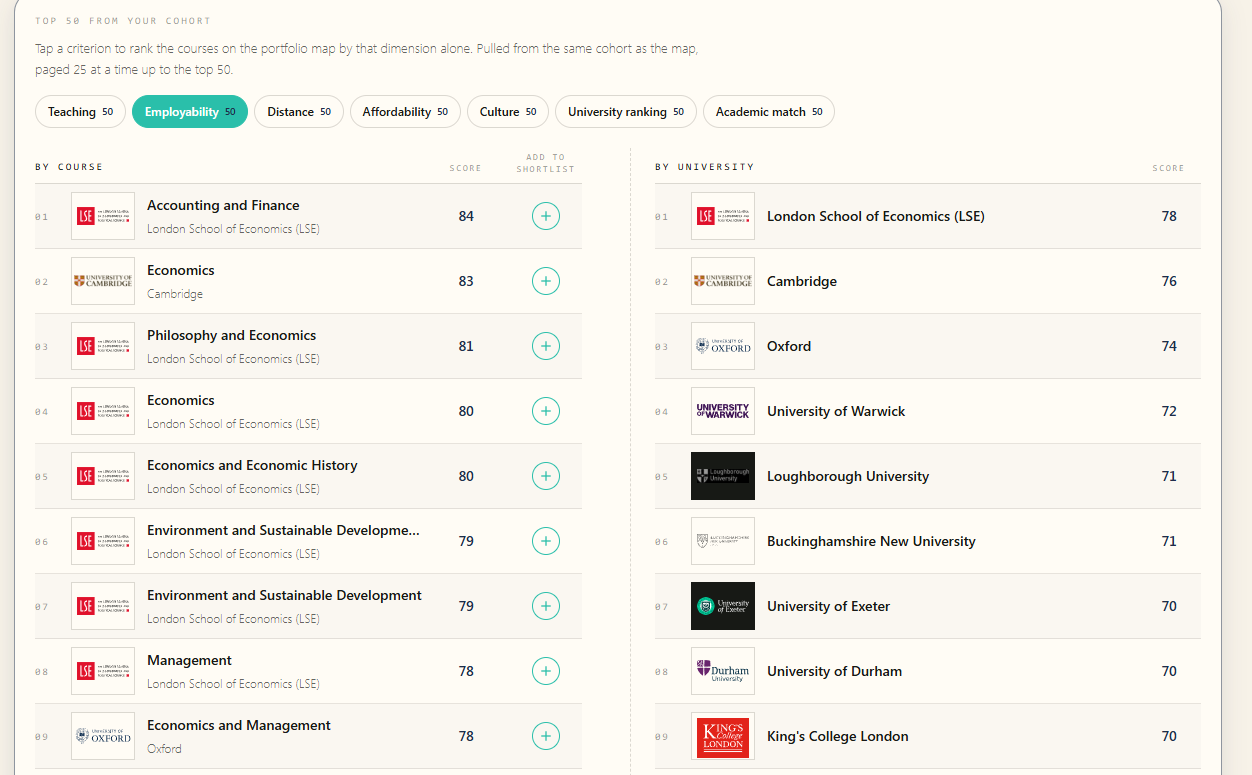
The top 50 in your cohort, ranked the way you choose.
No one has time to compare fifty courses by hand, so most students look at a handful and miss the rest. We rank the top fifty in your subject by whatever matters most to you, whether employability, distance, affordability, or academic match, course by course and university by university. Looking for something specific? Search for any course directly. Find one worth a place in your five, add it in a click, and the algorithm tells you straight away whether it strengthens your portfolio.
The portfolio map
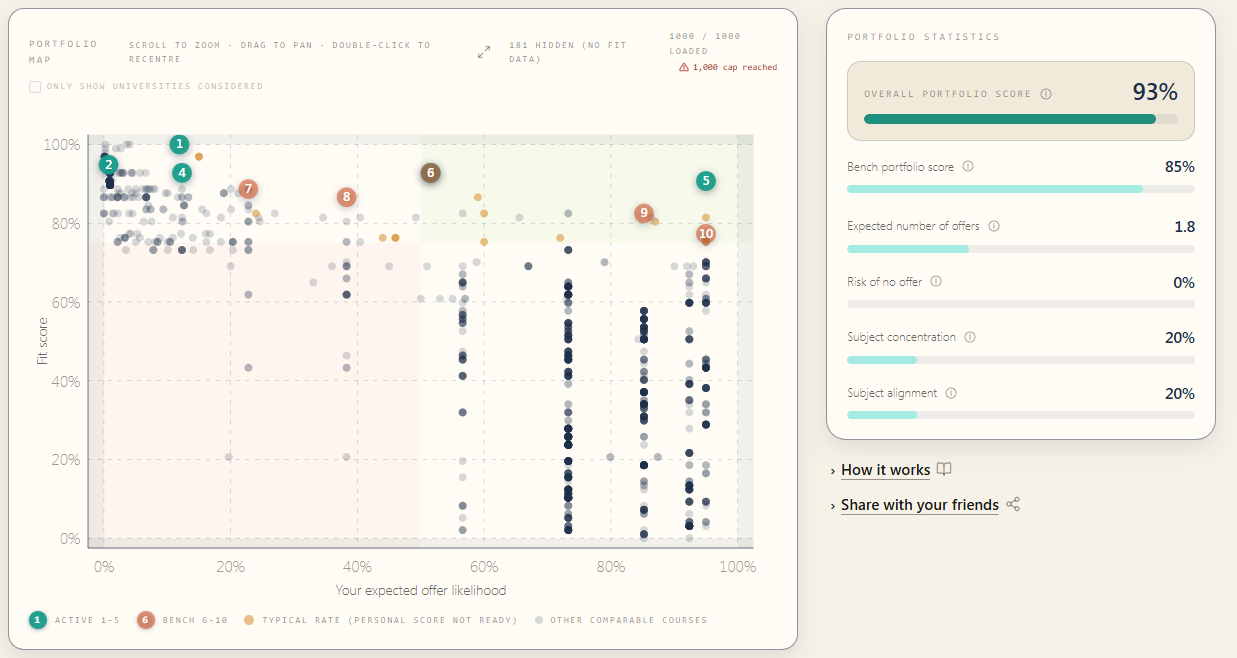
Compare every course in your subject at a glance:
Every comparable course in your subject is plotted by offer likelihood and fit, with your five marked on top, so you can instantly see how they stack up against everything else open to you.
The panel beside it scores the five as a portfolio: how many offers you can expect on average, your risk of walking away with none, and whether your choices are too concentrated or well balanced. It is the difference between five hopeful picks and a portfolio that actually holds together.
The Simulator
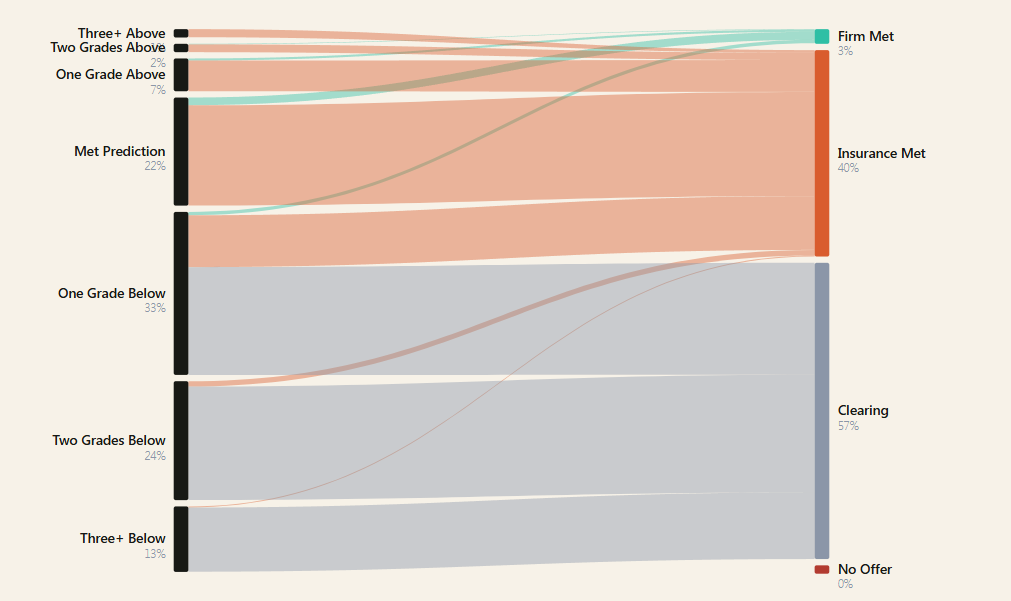
See what actually happens on results day.
Holding five offers is one thing. Meeting their conditions is another. Using thousands of Monte Carlo simulations, we run your profile through every plausible results-day outcome, so you can see how often you secure your firm, drop to your insurance, or go to Clearing. Test what happens if you miss your predicted grades by one, two, or three, and how a different insurance choice changes your safety net.
Every Oxbridge course, side by side
The right Oxbridge course is not always the obvious one.
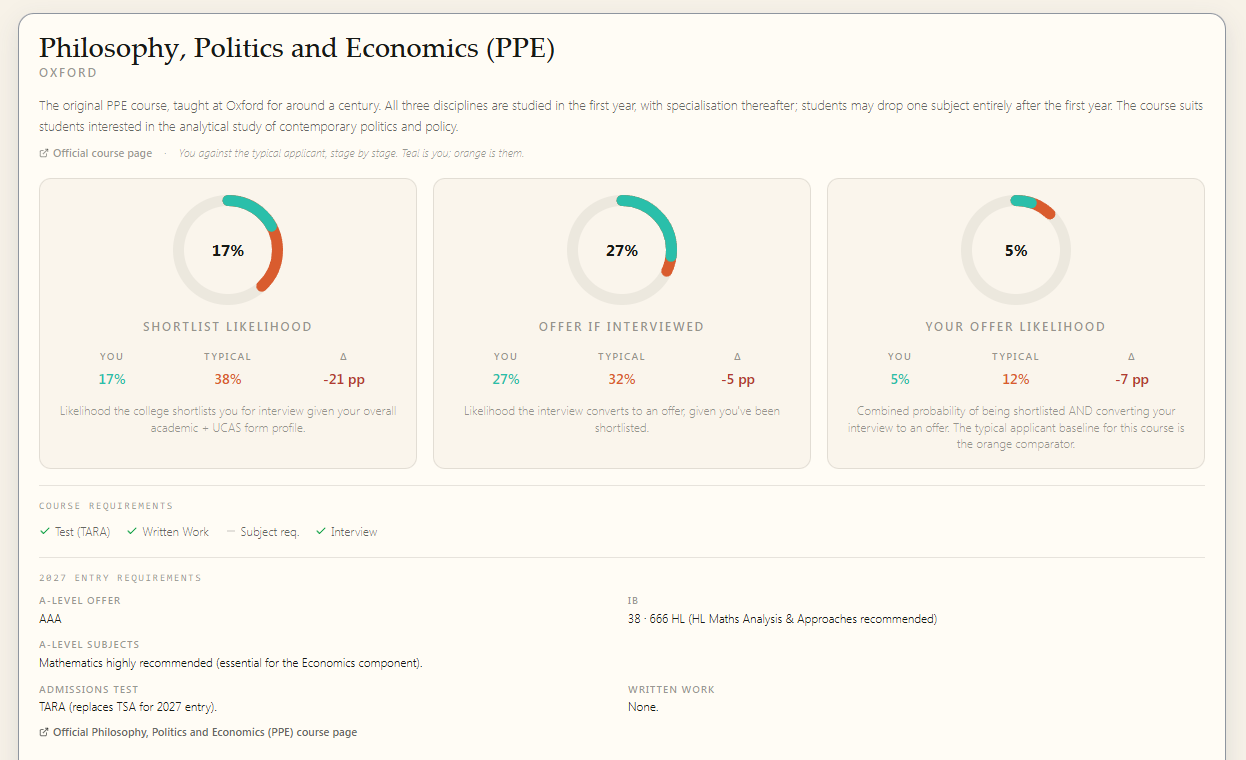
Most applicants pick Oxbridge subjects on instinct, without knowing how their chances differ across the catalogue. We rank all 48 Oxford and 29 Cambridge courses by your personalised offer chance, alongside the typical rate, so you can see at a glance which doors are open to you.
Sort by typical offer rate, your offer chance, or the gap between the two, so you can see where you're strongest relative to the field.
Filter by admissions test, written work, and subject pre-requisites to narrow to the courses you're actually eligible for.
Click any row to drop into the full course breakdown, with requirements and chances on one screen.
Understand colleges
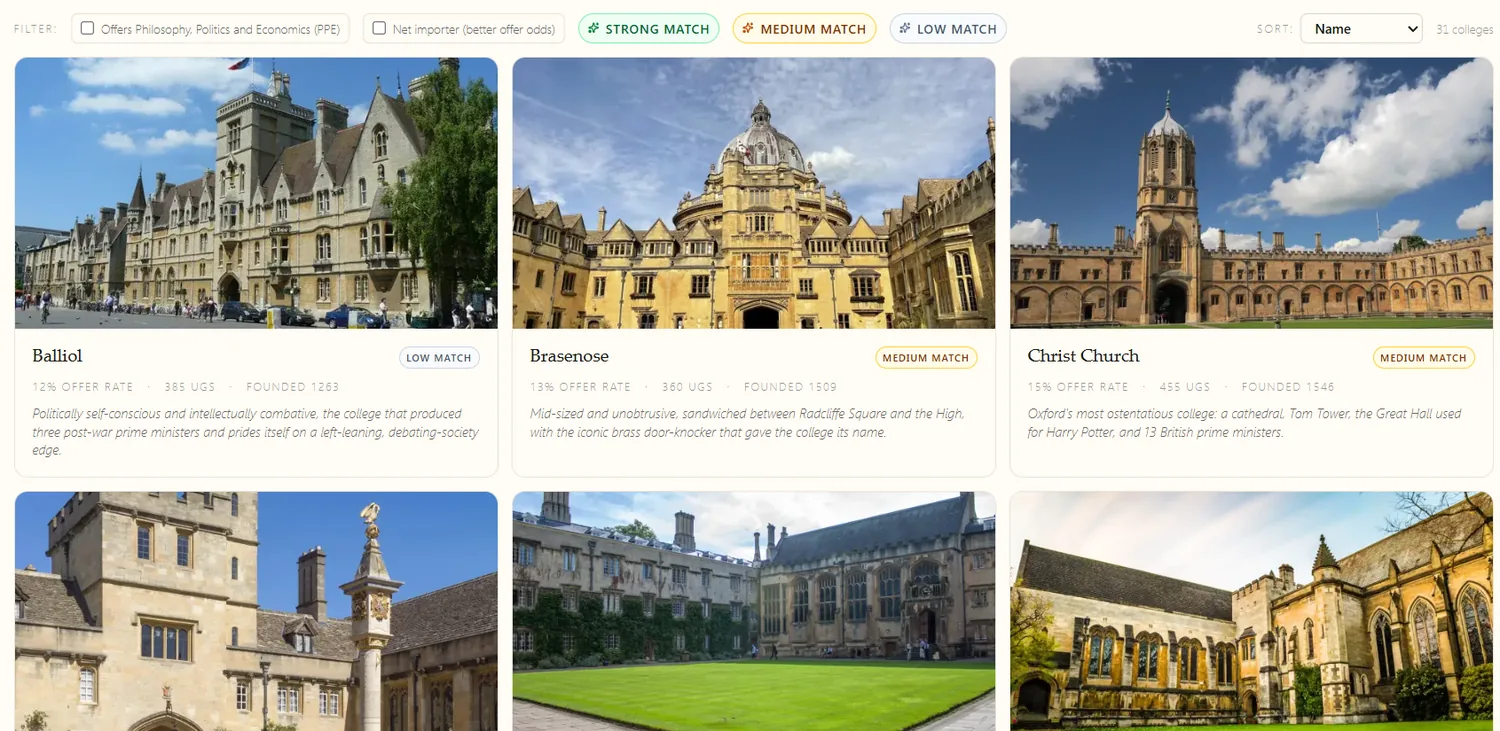
See which college actually fits you.
College choice can matter as much as the university itself, yet most applicants choose blind. Answer a few quick questions and we rank every college by how well it suits you, then lay out everything you need to compare them side by side: subjects offered, offer rate, endowment, size, and year founded. Everything that usually takes hours of digging, on one screen.
Profile breakdown
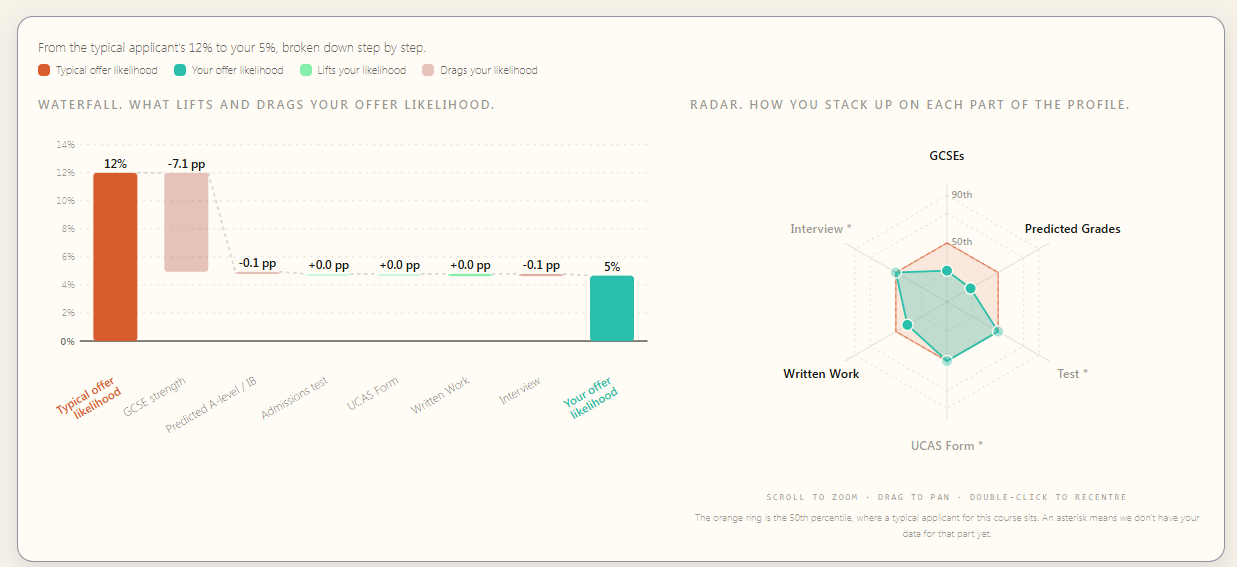
Know exactly why your Oxbridge offer chance is what it is.
The waterfall starts at the typical applicant's offer chance for this course and shows, step by step, how your profile lifts or drags the number to yours.
The radar plots you against the typical applicant on each part of the profile, including GCSEs, predicted grades, admissions test, UCAS form, written work, and interview.
We mark with an asterisk anything we can't yet score, such as a real interview performance, so you can see exactly what's in the model and what isn't.
For counsellors
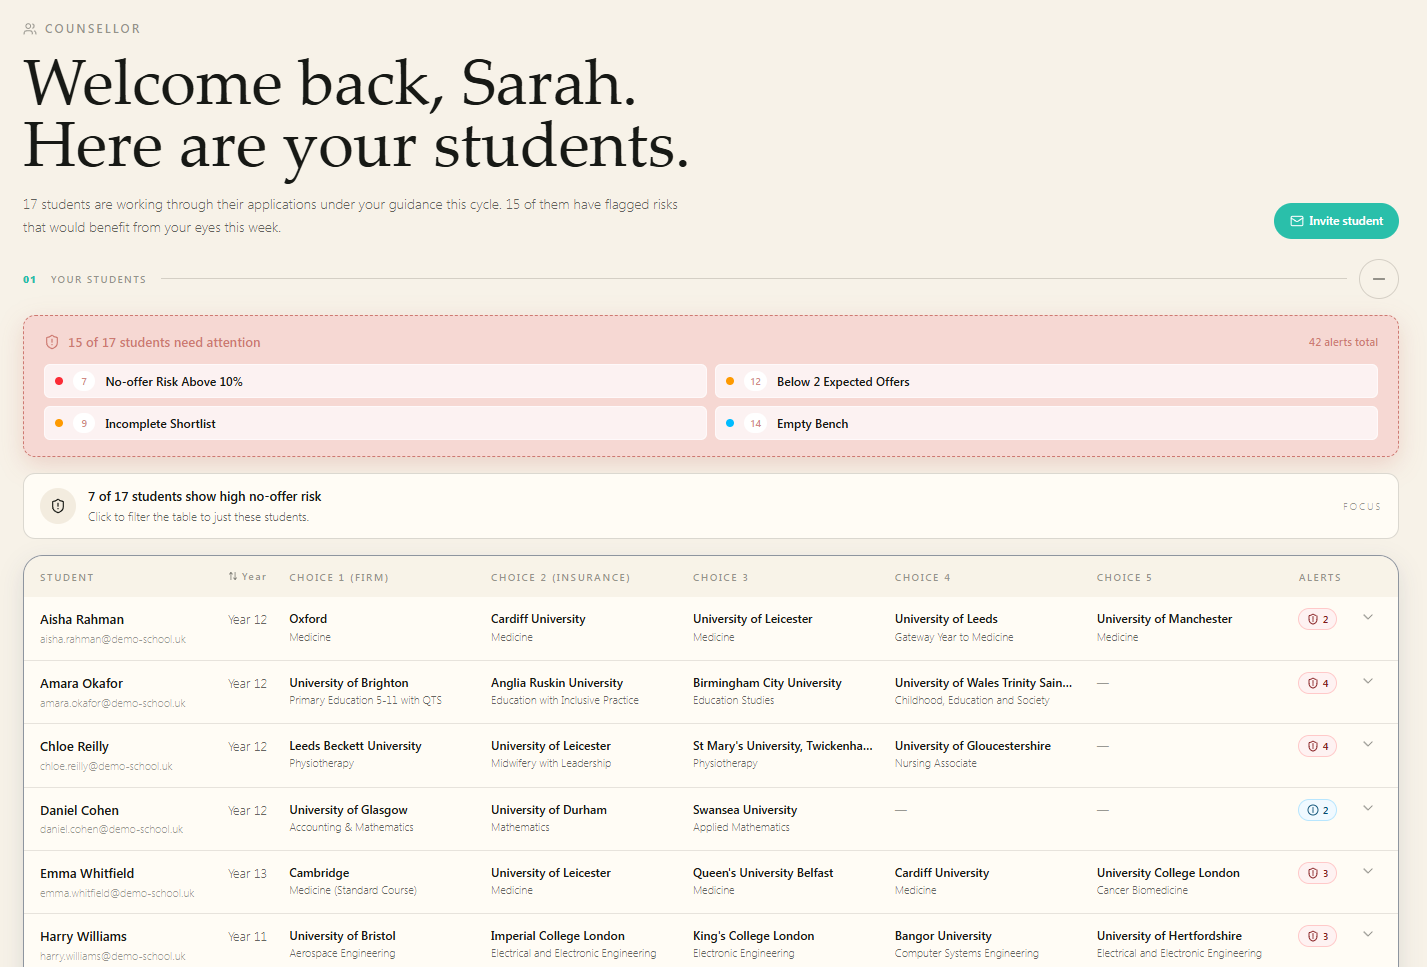
Every student, every choice, on one screen.
See your whole cohort at a glance: where each student is applying, their offer chances at every choice, and how their five stack up. The dashboard flags the students who need you most, whether they're applying to courses they don't meet the requirements for, carrying a low chance of any offer, or leaving their application unfinished. The students at risk surface to the top, so the afternoon you'd have spent chasing them is spent helping them instead.
Guide your students
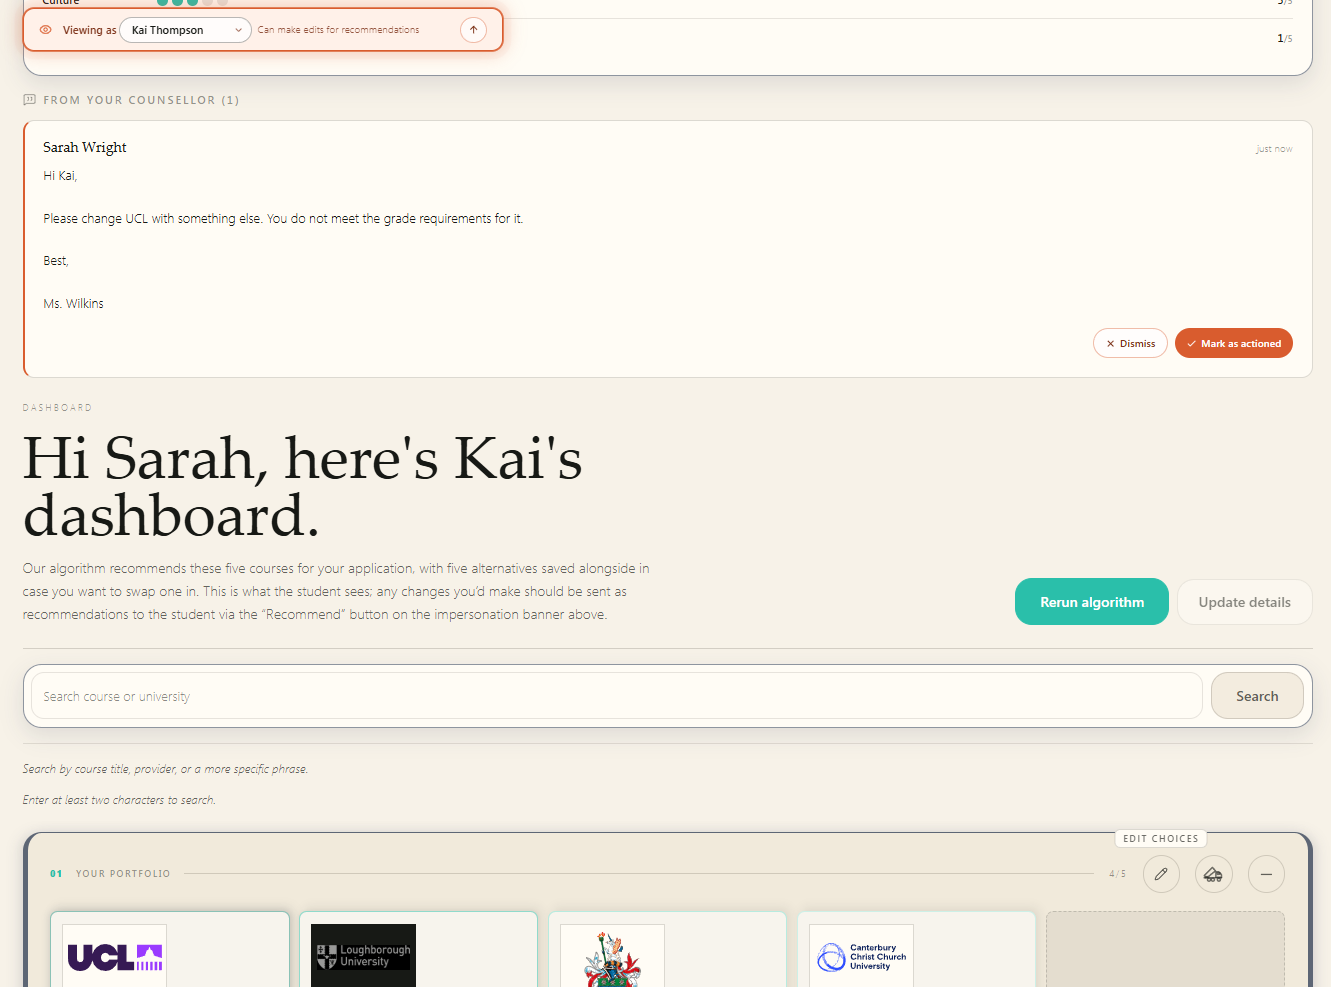
Step into any student's dashboard and guide them directly.
Open any student's view to see exactly what they see, then edit their choices yourself. Every change you make is sent to them as a recommendation, by email and on their dashboard the next time they log in, so your advice reaches them in the moment and in context. No more notes lost in a corridor conversation. The student stays in control of their final five; you make sure they're choosing from the right starting point.
Get in touch
Tell us about your data and the revenue you want to protect, and we will show you what a causal AI uplift layer could do for your churn, retention and recovery. Pilot partners shape the platform during the research preview, receive the service at a substantial discount to general availability pricing, and stay ahead of their market once it goes live.