
Higher education policy
How the UCAS process magnifies inequality
A market design that rewards information, mobility and risk tolerance turns equal grades into unequal places. How it happens, and what would fix it.
Originally published in two parts on HEPI, the Higher Education Policy Institute.
10 minute read
The evidence
The direction of travel for the 2026 UCAS admissions consultation is towards a reconceived and expanded Clearing. Historically having been perceived as a fire-sale where students disappointed by their A-Level results often end up equally disappointed by their choice of course, UCAS argue this characterisation is archaic. Indeed, the number of applicants who participate in this fire-sale willingly, hoping to land a course better than the offers they rejected, is now higher than those who arrive disappointed.
A reformed Clearing somewhat resembles an opt-in Post-Qualification Admissions (PQA) system, as it occurs after students receive their A-Level results. Thus, it may see many of the upsides of PQA, avoiding the oft-cited criticisms of predicted grades entirely, without the administrative revolution needed for full PQA reform. The former UCAS CEO, Mary Curnock Cook CBE, described an enhanced Clearing as:
giving choice and agency to students and could also presage a more gradual market-driven change in favour of a post-results system, avoiding the highly risky big-bang change approach.
While the 2026 consultation is clear about the importance of Clearing reform, the mechanics and structure of the ‘Clearing process for the future’ remain yet to be either designed or publicly disclosed.
In this context, it is necessary to shine some light on an underappreciated chart that is buried in a research report from the 2026 UCAS consultation. It is in need of further analysis. It shows how academic match varies by socioeconomic status, as students progress from Firm to Insurance to Clearing.
Academic match measures the difference between a student’s actual A-Levels and the median A-Levels of the cohort at the student’s chosen course. Hence, a score of 0.22 means that the student is overmatched by ~1/5th of a full A-Level grade, and is attending a course that they find too difficult compared to their peers. While overmatching presents its social challenges, such as greater drop-out rates, undermatching is a far graver social issue. A negative score of -0.30 means that the student, on average, received 0.3 A-Level grades higher than their peers in their cohort. It means that they are at a course that is too easy, having not fully realised their academic potential.
Academic match is often used as a proxy for fit by UCAS and the academic literature, mainly because the data are readily available and quantifiable. It is by no means a perfect measure. The best-matched course for any given student is not necessarily the most academically selective one their grades would allow, but the one that also reflects the things they actually care about, such as cultural fit, teaching scores, and proximity to home. Were a purer measure of fit available, the outcome inequalities described here may even be greater than those captured by academic match alone.
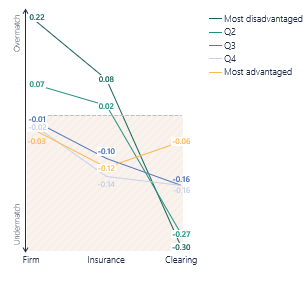
Exhibit A. How match quality varies by socioeconomic quintile across Firm, Insurance and Clearing.
Crucially, within high-attaining students, undermatching occurs more frequently and with greater severity among students from lower socio-economic backgrounds. Campbell et al. determined this gap to be worth, in median earnings difference after 5 years, £13,200 per year, or the difference between studying economics at LSE and Exeter. As such, undermatching has deservedly received sustained attention from academics, aiming to identify its causes and possible solutions. Explanations tend to focus either on students’ applications (demand) or universities’ admissions policies (supply). These are neatly summarised by Blanden et al.’s 2025 contribution, where they discussed as possible factors differences in pupils’ risk aversion, parental intervention and encouragement, school culture, and structural biases within university admissions. Largely absent from these explanations, and within the literature generally, is the market design of the UCAS process itself.
What then, does the graph actually tell us? Students from the most disadvantaged backgrounds overmatch their Firm choice by 0.22 of an A-Level grade, overmatch their Insurance by a smaller margin, and then, in Clearing, decline very starkly to undermatch by -0.30 of a grade. It is an accelerating slide through the phases that has no equivalent in the trajectory of their most advantaged peers, who track more or less flat across Firm and Insurance and, oddly enough, are the only quintile to improve at Clearing, drifting from -0.12 to -0.06.
Both demand and supply-side explanations struggle to explain the volatility and divergence between quintiles that emerges after offers are made. Thus, the argument is that the design of the UCAS process itself must multiply the inequalities that produce undermatching. Its design structurally rewards a specific bundle of resources at each stage, such as good admissions intelligence, geographic mobility, reliable predicted grades, and a measure of tolerance for risk. These are precisely the resources the literature consistently identifies as scarcest among disadvantaged students. Seen against this, the spread of average outcomes by quintile shown in the following graph is no surprise; it is, however, sobering.
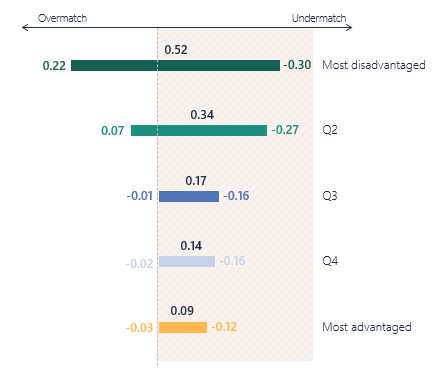
Exhibit B. How far each socioeconomic quintile swings, the range of match outcomes across UCAS pathways.
The most disadvantaged quintile (0.52) experiences nearly six times the within-applicant volatility of the most advantaged (0.09). It is the signature of a market design that systematically converts unequal inputs into more unequal outputs.
So how does it happen?
The underlying mechanics are best illustrated by introducing two applicants, Tom and William. Both are predicted AAA, both have applied to the five courses with the same offer spread, and both have received offers from all five; their position on paper is identical. The difference lies elsewhere. Tom comes from a privileged background and attends a well-resourced independent school, where he is carefully guided through his choices and actively encouraged to accept a place at the most competitive university his grades will reach. William attends a state school that offers little personal academic guidance and still less in the way of admissions counselling, where the single stretched member of staff responsible for the cohort, in the interests of fairness, can spare only 7 minutes for each student. Though stylised, let Tom and William represent the archetypal average advantaged and disadvantaged high-attainment student respectively. Let’s see what happens to them under different scenarios.
The walkthrough and proposals
This example now walks through what happens to Tom and William at Firm, Insurance and Clearing.
Firm
At the Firm stage, an applicant faces two unknowns over which they have no control.
- Prediction error. The difference between the student’s Predicted Grades and their actual grades. Murphy and Wyness show that for high-attaining students like William and Tom, state school students are roughly twice as likely to be underpredicted by two or more grades (23 per cent vs. 11 per cent).
- Course flex willingness. The gap between the A-Level offer grades and the level the course is, in fact, prepared to admit students on results day. The Sutton Trust reported that this concept is “well understood only by the best informed schools and colleges.”
Given these variables, the matrix below sets out the possible scenarios. These matrices are slightly simplified for readability.
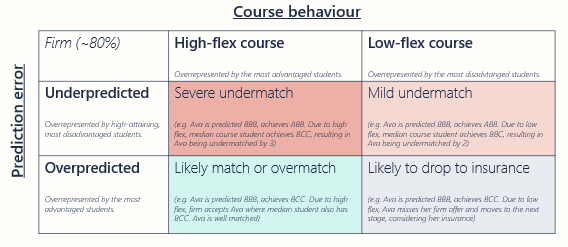
Exhibit C. How prediction accuracy and course flex jointly determine match quality at the Firm stage.
Tom, well briefed on the fact that a published offer is indicative rather than binding, takes the most ambitious of the five, A*AA, as his firm. William, however, takes the offer that matches his AAA prediction, reasonably assuming that the offer letters mean what they say. Tom achieves AAB, being a grade overpredicted; William achieves A*AA, being a grade underpredicted. Tom’s course, which flexes generously, admits him anyway, against a cohort whose median entrant sits 1 below advertised at AAA. With his AAB actuals, Tom finds himself overmatched by 1 grade.
William’s course also flexes, but William, having met his offer cleanly, has no need of it; the course admits him against a cohort that has been admitted, on average, one grade below the published threshold. With grades of A*AA against a median of AAB, William is undermatched by 2 grades. Two boys who began the cycle with identical predictions and identical offer portfolios end it 3 grades apart.
At the end of Part one, we introduced Tom and William and discussed how inequalities are magnified at the Firm stage. This piece continues and walks through what happens to them at Insurance and Clearing.
Insurance
The Insurance pathway is arguably the cleanest example of UCAS’s market design problem. It is, however, also the least used and is where the empirical data is scarcest. Only ~7% of students were placed through Insurance. Interestingly, 25% of students placed at their insurance choice declined their place and entered Clearing. A possible explanation for the greater willingness to reject insurance offers is the difficulty of making the correct insurance choice from the five. The applicant can only make one decision to accurately optimise for three unknowns, each out of his control. The decision is the size of his insurance gap, meaning the difference between offer grades at Firm and Insurance. With it, he must (1) balance his belief about his prediction error, the (2) willingness of his firm offer to flex, and (3) the willingness of his insurance offer to flex.
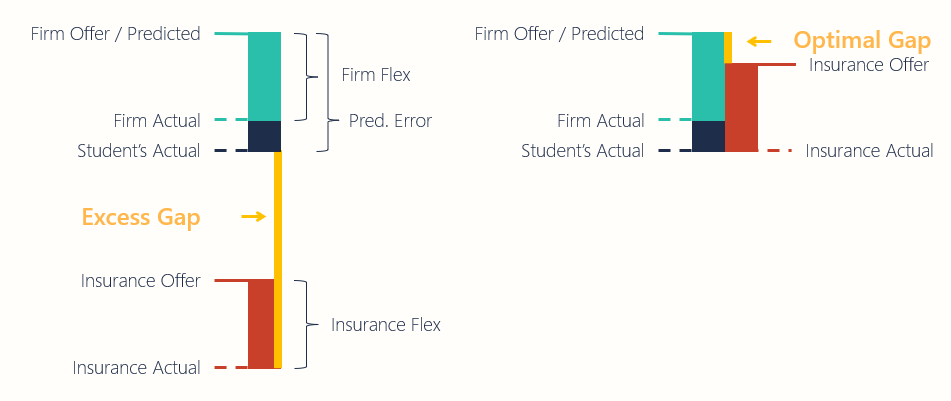
Exhibit D. How firm flex, prediction error and insurance flex combine to size the cushion.
The exhibit makes clear that, in most cases, the optimal gap is often much smaller than it appears intuitively, and that in any case, it is very difficult to size. It follows that better-informed students with better resources would be, all things being equal, more likely to size the gap optimally. However, the data states the most disadvantaged quintile only selects a gap 0.06 larger than the most advantaged, where the mean insurance gap is approximately 1 grade point. Strangely, 22% of applicants chose no insurance gap at all, and, more strangely, 14% of applicants chose a negative gap, i.e. an insurance choice with higher entry requirements than the firm choice.
UCAS itself admits this could be due to differences in insurance flex but states it cannot be sure. Perhaps that is the point worth dwelling on, a phase whose design is sufficiently opaque that even those who built it, with the full data in front of them, cannot quite tell what it is doing. The mechanics of Insurance warrant closer study than there is space for here, and a good deal of interesting material has been left out for brevity. That matters all the more because Insurance, in some form, is likely to remain. The Insurance stage produces the following matrix.
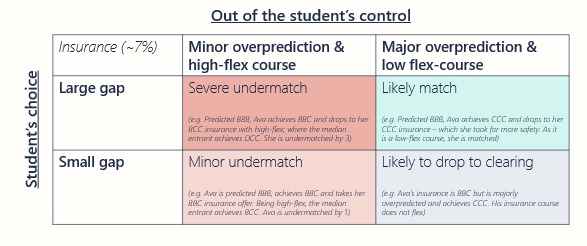
Exhibit E. How insurance gap sizing and factors beyond the applicant’s control jointly determine match quality at the Insurance stage.
In this case, Tom achieves a ABB and misses his firm choice. He, owing to the advice of his university counsellors, chose an insurance that matched his predicted grades, namely AAA. He did so with the understanding that this course has historically flexed their offer by two grades. This proved correct, and Tom is accepted onto a course where the median cohort, similarly flexed, also sits at ABB. Tom is well matched.
William, lacking the same counsel, falls back on the perfectly reasonable instinct that an insurance ought to sit a couple of grades below the firm, and chooses a gap of two. Like Tom, he was predicted AAA, and like Tom he achieves ABB. To his own eye the gap has been sized correctly. What he has not been told, and what the published offer letter does not say, is that his course flexes by the same two grades that Tom’s does. His new peers sit, on average, at BBC. William is undermatched by two grades, on the same achievement, in the same cycle, and by the same mechanism that has just placed Tom at the median.
Clearing
Clearing is where undermatching inequality is magnified to the greatest extent. Although it accounts for ~13 per cent of applicants overall, its share has steadily been rising. The average disadvantaged student falls from 0.08 overmatched in Insurance to -0.30 undermatched in Clearing. In contrast, the average advantaged applicant rises from -0.12 to -0.06. Two variables do the work.
- Search quality refers to how well a student runs their Clearing process. Advantaged students tend to do considerably better. They understand the process, have spoken to more people who have been through it, and recognise the urgency.
- Course availability refers to the supply of well-matched courses for the student available in Clearing. Disadvantaged students apply to more competitive courses where clearing places are rare. In addition, 75 per cent of the most disadvantaged quintile in Clearing live at home while studying. Both these factors severely constrain the number of similarly matched courses available to them.
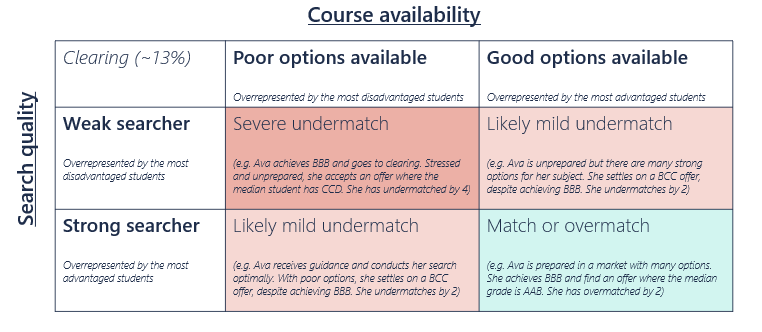
Exhibit F. How course availability and search quality jointly determine match quality at the Clearing stage.
Tom achieves ABB, two full grades short of his prediction. A high tariff provider, which is his insurance choice, lets him know that it is willing to flex regardless. His private tutor has, however, briefed him on a more interesting possibility; if he is quick about it, a very high tariff provider has recently been admitting applicants of exactly his profile in Clearing, and he can trade up if he releases himself. While Tom hopes to land his firm, he is ready to call this very high tariff provider the moment results are released if needed. Upon hearing the news, Tom briefly postpones his disappointment and immediately calls this other university, where he is offered a place on the same morning. Here, his peers average AAA, and Tom is overmatched by 2 grades.
William also achieves ABB, and misses both offers; his insurance, unwilling to flex because he chose Medicine, the most competitive subject in the UK, lets him go. He is shocked and stressed by missing both of his offers, and spends the morning processing and consoling with family, not knowing how frantic the Clearing process is for the most competitive courses. By the afternoon, when he begins to look, the Medicine places have gone. Only then does he stumble across an article that says that there are usually fewer than 10 Medicine Clearing places in the entire country, and that they often disappear within minutes. The stress of missing both offers is now compounded by the stark possibility that the career he has wanted for years may be out of reach.
What is more, William cannot afford to live away from home, which fixes him in the North East, where the strong universities within reach are few. His A-level choices, picked years ago with Medicine in mind, are too specialised for most of what remains. Clearing is sold as the system’s safety net, but for William it is a snare. The social constraints he came in with do not loosen at this stage but bind harder. In the end, he finds one of the few courses remaining willing to take him, Biomedical Science at a local university where the median grade is BCC. William has undermatched by 3 grade points.
The temptation to read William as a contrived extreme is understandable but, on the data, misguided. Exhibit A shows that the Clearing drop-off is extreme, precisely because course constraints, information asymmetry, and time pressure all bind at the same moment. It is socially regressive by design. Clearing is a fire-sale not only in the figurative sense but also in the literal one as universities must clear their remaining places within a short window. Why, then, the proposal to expand the one phase of admissions designed in the image of a Black Friday sale?
Recommendations
Deferred acceptance algorithm for Clearing. Some have proposed a matching algorithm, like the one used to allocate London pupils to schools, under which students rank their courses, universities rank their applicants, and it assigns each student to the best course they qualify for. In practice, the most academically selective course that one’s grades would allow is not usually the best fit, and any honest treatment of the question would need to quantify fit by way of the factors that actually matter to students, such as proximity to home, teaching quality, the staff-to-student ratio, and cultural match. Assuming this could be done, applying this algorithm to Clearing would neutralise the fire-sale dynamics described above in favour of an ordered, fair queue. It can be designed to be socially progressive, with universities filling access places first, as proposed by Doğan and Erdil in 2025. Clearing Plus got halfway there, but the matching is one-sided, as only universities submit their preferences to the algorithm without input from the students.
Minimise information asymmetries. Much of the issue stems from the fact that applicants are acting with imperfect information. Students with better information about their likely prediction error and firm flex willingness are much less likely to undermatch. The UCAS Historical Grades tool, launched in 2024, is an attempt to correct for this. Its direction is correct, but its execution is flawed. Students have been quick to flag inconsistencies across universities, small sample sizes, and UCAS’s own guidance, which instructs users not to draw predictive inferences from the data, is self-defeating.
Early two-way signals. While prediction error is very difficult to predict, insurance gaps, firm flex and insurance flex are easier. Even prediction error can be partly captured by covariates, such as socioeconomic information, GCSE attainment, subject concentration, and, most directly, the student’s own answer to the question of whether they suspect they have been over-predicted. Taken together, these inputs allow students at high risk of severe undermatching to be identified before Clearing opens, and the resulting signal can be sent to both sides of the market.
For the student, the message can be advisory. “Something to consider, Clearing is likely to offer you a better match than your insurance.” The value of receiving it before results day, rather than at the moment of decision under time pressure, is that the student can prepare, research the alternative courses, and act with the kind of information disadvantaged applicants have so far been least likely to hold. For the university, the signal helps reduce marketing spend, of which Clearing often constitutes a significant portion.