How do you know whether your 5 university choices are the best for you?
How do you know whether your 5 university choices are the best for you? This was the guiding question behind Unimetrica, and the one we set out to try and solve. As a starting point, they are most probably not. There are approximately 53,000 courses currently listed on UCAS, meaning there are approximately 3.4 sextillion possible five-choices portfolios. That is the same as the number of grains of sand on the planet, 450 times over. While in reality that number is likely smaller as you’re not considering all 53,000 courses, the vast number of combinations is illustrative nonetheless.
This problem is not, however, merely theoretical. It is also a social one. Academic literature shows that 23% of UK students undermatch, meaning that they are placed into courses that they find too easy, which damages future earnings prospects and fulfilment on the course. In addition, 22% of students overmatch, meaning they find the course too hard, leading to increased drop-out rates during the course. Importantly, the academic literature only considers grades and academic attainment when determining a match, excluding important ‘fit’ factors such as proximity to home, culture, and student welfare.
Moreover, the literature suggests that students from poorer backgrounds end up with worse matches overall. They point to greater risk aversion and information asymmetries being the cause, as socially advantaged students are more likely to be better resourced when choosing their universities. For undermatching, the difference between the wealthiest 20% of students and poorest 20% of students is, for the same grade on average, equivalent to £13,200 per year in median graduate earnings 5 years after graduation, or the difference between studying economics at LSE and at Exeter.
Hence the problem is real, most applicants do not apply to the 5 best courses for them.
As any student or university counsellor will attest to, picking five courses is difficult. First, what do we mean by best? Each applicant has different preferences: some value graduate employability, others nightlife, and many just want to be close to home. Preferences are personal, and it is both difficult and time consuming, to endlessly scroll through UCAS and university course websites to see which could be a good fit. What if there is a course you missed? What about a university you didn’t realise existed? Not only that, this must be balanced against whether you will get in, with all the uncertainty produced by predicted grades and the fact that many universities will still let you in even if you miss your offer. Picking your 5 courses is a jigsaw with thousands of pieces in the box, no picture on the lid, and only five slots that have to be filled.
At Unimetrica, we believe maths can solve this problem, with an algorithm that finds the 5 pieces that fit.
A familiar problem in a different guise
In 1952, Harry Markowitz wrote a paper, later a Nobel-winning one, on how to choose the best stocks to invest in. His insight was that a sensible investor does not just pick the five stocks that he thinks would give him the most money, adjusted for the level of risk. A sensible investor considers how the investments work together as a group, by considering the expected return of each, the volatility of those returns, and the correlations between them. For example, you might think the five best stocks are all oil companies. But if you buy all five, you’ve put all your money in one place. If the price of oil falls, you lose on every one of them at once. Hence, you want a way to design a portfolio of stocks whose properties, when looked at together, are a better investment than the sum of its parts.
Picking 5 university courses is largely the same problem in disguise. A set of 5 applications is a portfolio of risky bets, where each bet may or may not pay off; you may or may not get an offer. Each offer, if it comes through, hands you a different prize: a different course, a different city, a different set of peers, and a different set of doors opened on graduation. Your 5th choice is, by definition, your 5th choice, for whatever personal reasons rank it below the others. Each application is uncertain, and each affects the value of the others. If all 5 of your choices require an A in Maths, your whole portfolio rests on one exam. Slip a grade in Maths, and every offer falls at once.
While the stock-picking analogy is a useful start, its mathematics turns out to not be the most directly applicable for UK university applications. Instead, we must look at the model developed by economists Hector Chade and Lones Smith in 2006 for the specific problem of university applications. The key difference is that, unlike a portfolio of stocks, the applicant can only go to one university, and will choose the one that is the best fit.
An optimal portfolio function for UK university applications
The portfolio’s expected value is the fit she can expect on average from her five applications, taking into account both how good a fit each course is and how likely it is to make her an offer. The algorithm picks the five courses that make this number as high as possible.
The logic works backwards through the portfolio. Of the five courses on her list, ranked from highest fit to lowest, she will go to the highest-ranked course that admits her. So the top course contributes its full fit, weighted by the probability she gets in. Each course below it contributes its fit only in the scenario where every course ranked above has rejected her.
This is what makes the problem interesting, and what makes the answer different from simply ranking courses by their individual expected value. The value of adding any course to the portfolio depends on what is already in there. A course where the offer is almost certain looks attractive on its own, but if the portfolio already includes a similar course, adding another adds very little. A second safety does not protect any better than the first.
We have built statistical models that work out, for any student and any course, how likely the offer is and how good the fit would be. The student tells us about themselves (their grades, their subjects, what matters to them when picking a university) and the models do the rest.
The algorithm then picks the course with the highest individual expected value first. Then at each step it looks at every remaining candidate and asks: if this one were added to the portfolio so far, how much would the expected value rise? The course with the largest rise is added next. Five passes, and the portfolio is built.
The formula behind the calculation is shown at the bottom of the article. Chade and Smith proved in 2006 and 2014 that this approach finds the mathematical optimum. No other combination of five courses from the candidate list can produce a higher expected value than the one the algorithm returns.
A worked example
Consider a student predicted BBB, interested in Business and Management. Seven courses sit on her candidate list, drawn from the universities her grades and subject choices make her eligible for.
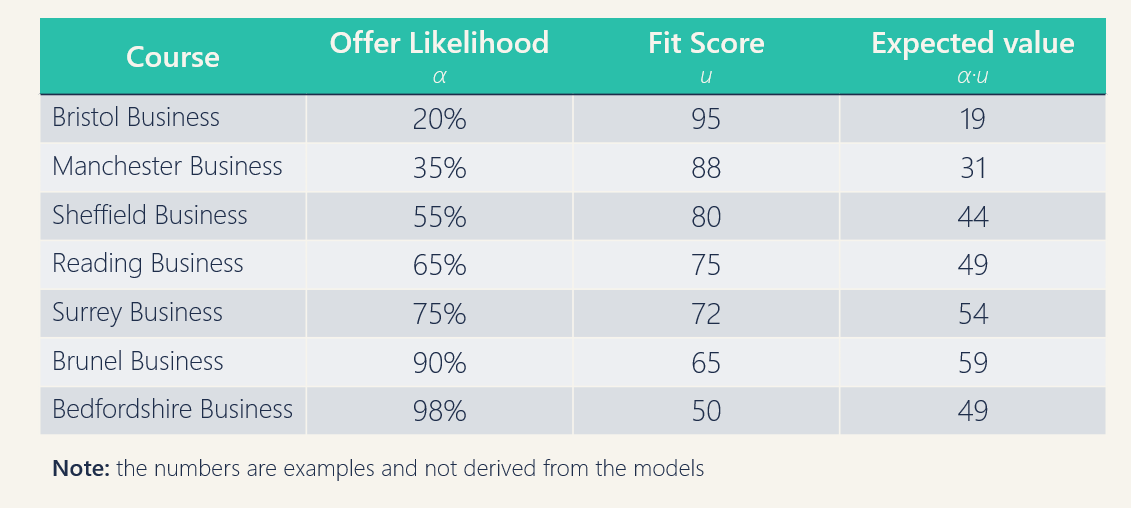
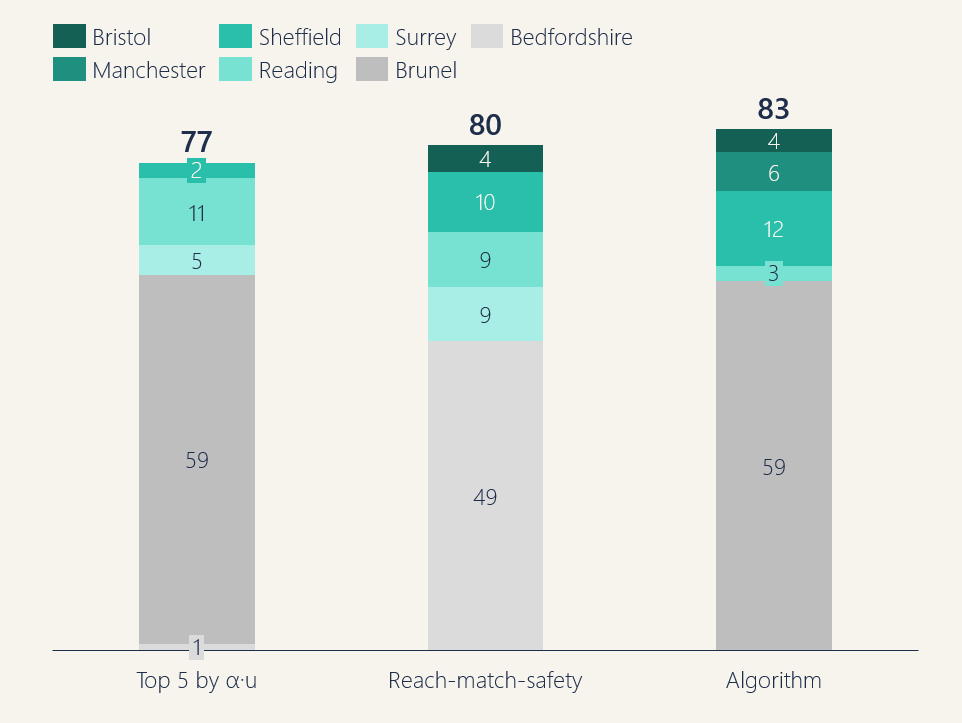
One approach would rank these by individual expected value (α·u) and pick the top five. That would mean dropping Bristol and Manchester, since their low offer probabilities give them the lowest individual expected values. This produces an overall score, or V(S) of 77.
Another approach, often the conventional one, picks 1 reach, 3 matches and 1 safety. This would pick something like Bristol, Sheffield, Reading, Surrey and Bedfordshire. It produces an overall score of 80. Can the algorithm do any better?
The algorithm picks Bristol, Manchester, Sheffield, Reading and Brunel. It produces an overall score, or V(S), of 83 — which is the highest mathematically possible. Notice that the algorithm picks two ‘reaches’, Bristol and Manchester. The algorithm reasons about the portfolio as a whole, asking what each course contributes given what is already in, while the conventional approach reasons about each slot in isolation.
Why the algorithm picked this set
The algorithm’s central idea is that each course should be judged not on its own merits but on what it adds to the four others. This produces two results that look counterintuitive at first. Bristol stays in the portfolio despite a 20% offer probability, because the high fit means that the rare scenario where she gets in is very valuable, and the cost of including it is small. Surrey, with a much higher offer probability and a respectable fit, is dropped, because Sheffield and Brunel already cover the middle of the range and a third middle option contributes almost nothing on top of what they provide.
Students often do the opposite. They drop the long shots because they look risky in isolation, and they crowd the middle because each middle option looks reasonable in isolation. Reasoning about the five together, rather than one at a time, flips both decisions. By optimising the portfolio properly, we are minimising the risk aversion the academic literature has identified as a cause of undermatching.
We would encourage you to try our tool and see which 5 courses optimise your portfolio.
Furthermore, the tool is also useful because there are thousands of courses on UCAS, and almost no one looks at more than a tiny fraction of them. Most students end up applying from a shortlist of fifteen or twenty universities they had heard of before they started, and which fifteen or twenty those are has more to do with their school, their friends, and which open days were nearby than with what would actually suit them.
We have catalogued every course at over 160 universities. The algorithm starts from the full universe of options you are eligible for, rather than from a shortlist assembled by circumstance. This alone may go a small way towards addressing undermatching, since students cannot apply to courses they have never heard of.
You tell us what you care about, and the algorithm weighs every eligible course against your preferences and your profile. The 5 it returns, as well as the 5 we choose as reserves, are often not the 5 you have in mind.
The tool is currently completely free to use.
Current limitations of our tool
We must stress that our tool is currently in its research preview. We would love your feedback to see how we can improve it, and make it more useful for you, your peers and your school communities.
There are still many things it does not account for that we are actively incorporating and testing. For example, it only works for students with GCSEs and A-Levels/IB. It also does not account for whether you qualify for contextual offers.
Mathematically, the offer likelihood currently assumes all outcomes are independent. Modelling this properly (with covariance) requires data on joint application outcomes that is not currently publicly available. We hope that by attracting students to use it for our research preview, we can collect the data for use internally so that we can factor this in.
To reflect these uncertainties honestly, we present offer likelihoods as ranges.
Perhaps most importantly, the model only tells you about offer likelihood and fit. It does not say how likely you are to convert this offer, or how hard the offer is to achieve given your predicted grades. We are working on implementing this functionality.
For all these reasons, we also highly recommend that you discuss the courses shortlisted by the tool with your university counsellor or other sources of support.
Formula
V(S) = α₁·u₁ + (1−α₁)·α₂ ·u₂ + (1−α₁)(1−α₂)·α ₃·u₃ + (1−α₁)(1−α₂)(1−α₃)·α ₄·u₄ + (1−α₁)(1−α₂)(1−α₃)(1−α ₄)·α₅·u₅
Where αi is the probability of receiving an offer from course i, and ui is the fit of course i.
For those interested in the mathematics behind, we have attached the PDFs for the papers that underpin the algorithm and the Monte Carlo simulation:
Sources and further reading
- Ali, S. N. and Shorrer, R. I. (2025), “Hedging When Applying: Simultaneous Search with Correlation,” American Economic Review.
- Anders, J., Dilnot, C., Macmillan, L. and Wyness, G. (2022), “Grade expectations: How well can past performance predict future grades?” Education Economics 31(4), pp. 397–418.
- Blanden, J., Cassagneau-Francis, O., Macmillan, L. and Wyness, G. (2025), “Private Highs: Investigating University Overmatch Among Students from Elite Schools,” IZA Discussion Paper 18171.
- Campbell, S., Macmillan, L., Murphy, R. and Wyness, G. (2022), “Matching in the Dark? Inequalities in Student to Degree Match,” Journal of Labor Economics 40(4), pp. 807–850.
- Chade, H. and Smith, L. (2006), “Simultaneous Search,” Econometrica 74(5), pp. 1293–1307.
- Chade, H., Lewis, G. and Smith, L. (2014), “Student Portfolios and the College Admissions Problem,” Review of Economic Studies 81(3), pp. 971–1002.
- Doğan, B. and Erdil, A. (2025), “Widening Access in University Admissions,” Journal of Economic Theory 224, 105973.
- Fu, C. (2014), “Equilibrium Tuition, Applications, Admissions, and Enrollment in the College Market,” Journal of Political Economy 122(2), pp. 225–281.
- Gale, D. and Shapley, L. (1962), “College Admissions and the Stability of Marriage,” American Mathematical Monthly 69(1), pp. 9–15.
- Markowitz, H. (1952), “Portfolio Selection,” Journal of Finance 7(1), pp. 77–91.
- Murphy, R. and Wyness, G. (2020), “Minority Report: the impact of predicted grades on university admissions of disadvantaged groups,” Education Economics 28(4), pp. 333–350.
- Roth, A. (1984), “The Evolution of the Labor Market for Medical Interns and Residents: A Case Study in Game Theory,” Journal of Political Economy 92(6), pp. 991–1016.
- Shorrer, R. (2019), “Simultaneous Search: Beyond Independent Successes,” in Proceedings of the 2019 ACM Conference on Economics and Computation (EC ’19), pp. 347–348.
- Stigler, G. (1961), “The Economics of Information,” Journal of Political Economy 69(3), pp. 213–225.
- Weitzman, M. (1979), “Optimal Search for the Best Alternative,” Econometrica 47(3), pp. 641–654.
- Wyness, G. (2017), Rules of the Game: Disadvantaged Students and the University Admissions Process, London: The Sutton Trust.